.NET Ultimate Anti-debugging

This article introduces the anti-debugging principle under .NET, including the CLR internal debugging mechanism. Through this article, you can learn how to use the CLR debugging mechanism for detection and prevention of debuggers.

Introduction

0xd4d has written a project called antinet which is designed to be an anti-debugger and anti-profiler tool. The code is available on GitHub. This anti-debugging principle is not based on detection, but rather on active attacks. If successful, certain fields related to debugging in CLR will be directly destroyed, causing the debugger thread to exit and preventing other debuggers from attaching. In theory, this anti-debugging method is almost insoluble unless the identification mechanism within it is invalidated.

Therefore, I made some improvements to this code, such as adding Win32 function detection of debuggers and CLR internal function Hook detection, and removed the anti-analyzer code because it was not very useful for anti-debugging and did not look particularly stable. The improved code can be found here: https://github.com/wwh1004/antinet

Here is the download address of sscli20, because sscli20 will be used in the article analysis. You can download it from GitHub.

SSCLI/sscli20_20060311

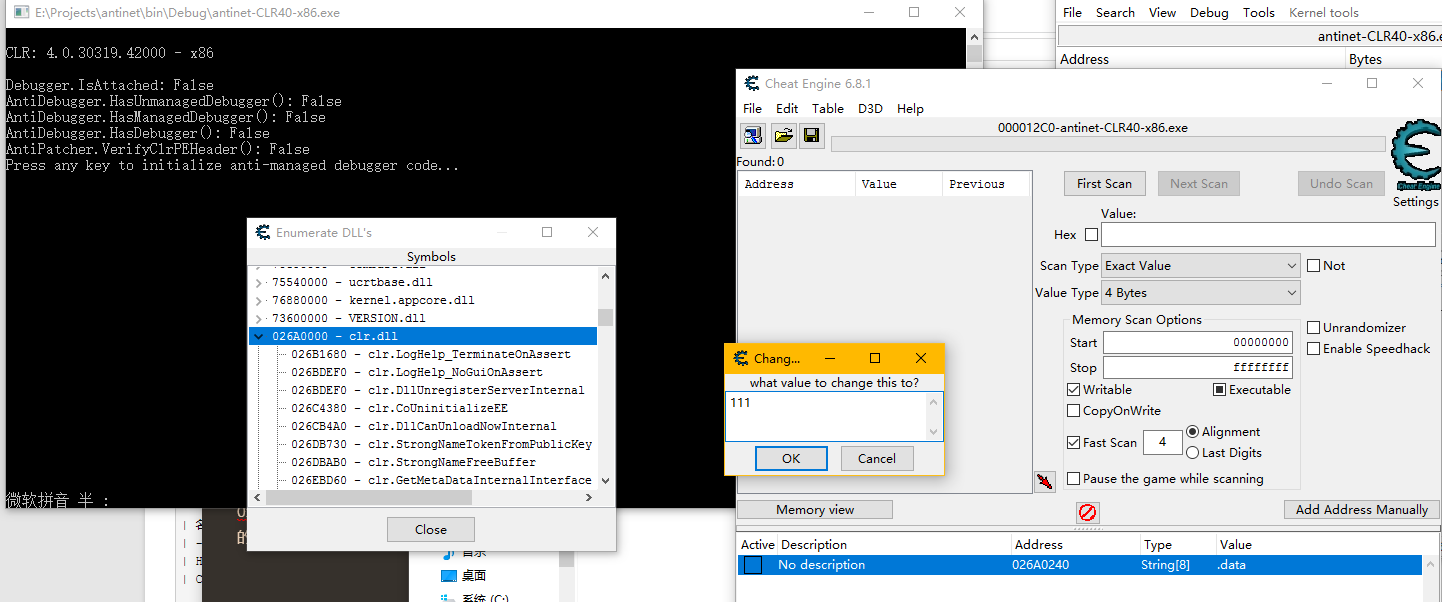
Before reading this article, please make sure to open the modified antinet in the VS (the download link is provided above), otherwise it may be unclear what the article is about!!!

0xd4d’s AntiManagedDebugger

Overview

This is the anti-debugging class of 0xd4d’s antinet, which I have not modified and kept, and added comments to it.

Firstly, let’s take a look at how 0xd4d explains the principle of AntiManagedDebugger.

Open https://github.com/0xd4d/antinet and find “Anti-managed debugger”, below which is “Technical details” where the implementation principle is explained:

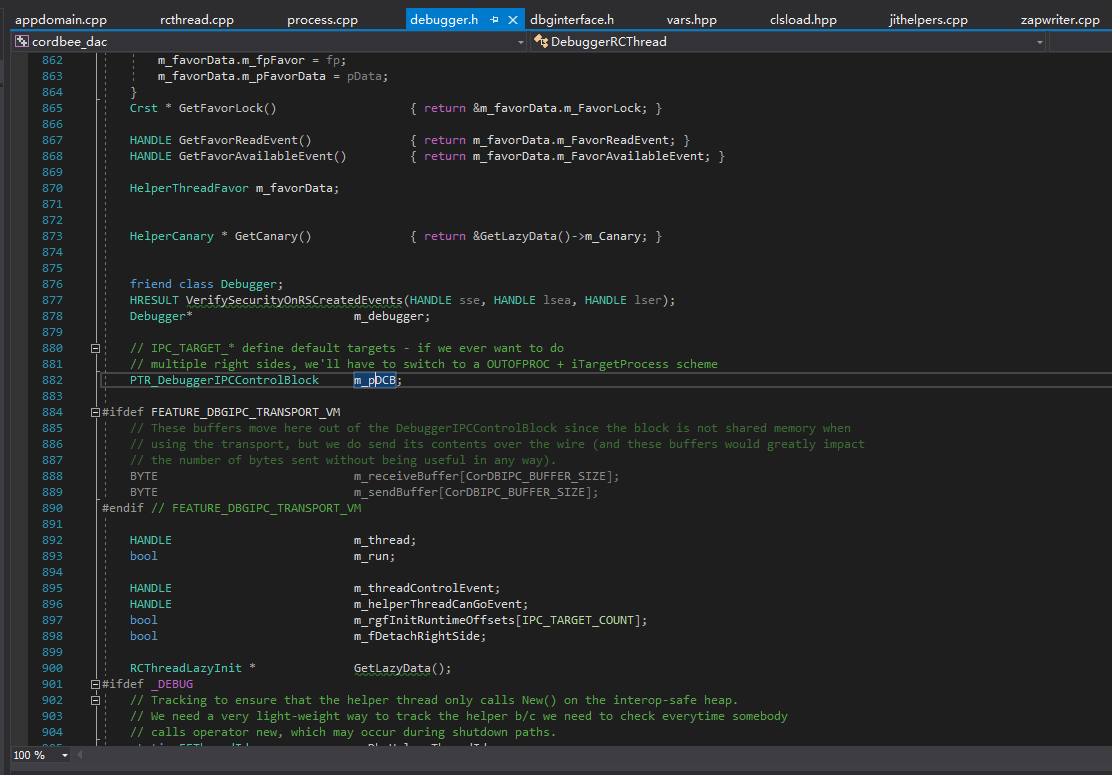
When the CLR starts, it creates a debugger class instance (called Debugger). This class will create a DebuggerRCThread instance which is the .NET debugger thread. This thread is only killed when the CLR exits. To exit this thread, one must clear its “keep-looping” instance field, and signal its event to wake it up.

Both of these instances are saved somewhere in the .data section.

In order to find the interesting DebuggerRCThread instance, we must scan the .data section for the Debugger instance pointer. The reason I chose to find this one first is that it contains the current pid which makes finding it a little easier. When we’ve found something that appears to be the Debugger instance and it has the pid in the correct location, we get the pointer to the DebuggerRCThread instance.

The DebuggerRCThread instance also has a pointer back to the Debugger instance. If it matches, then we can be very sure that we’ve found both of them.

Once we have the DebuggerRCThread instance, it’s trivial to clear the keep-looping variable and signal the event so it wakes up and exits.

To prevent a debugger from attaching, one can clear the debugger IPC block’s size field. If this is not an expected value, CordbProcess::VerifyControlBlock() in mscordbi.dll will return an error and no debugger is able to attach.

If you don’t understand it, it’s okay to have a rough idea. Let’s take a look at the code of the AntiManagedDebugger class in VS.

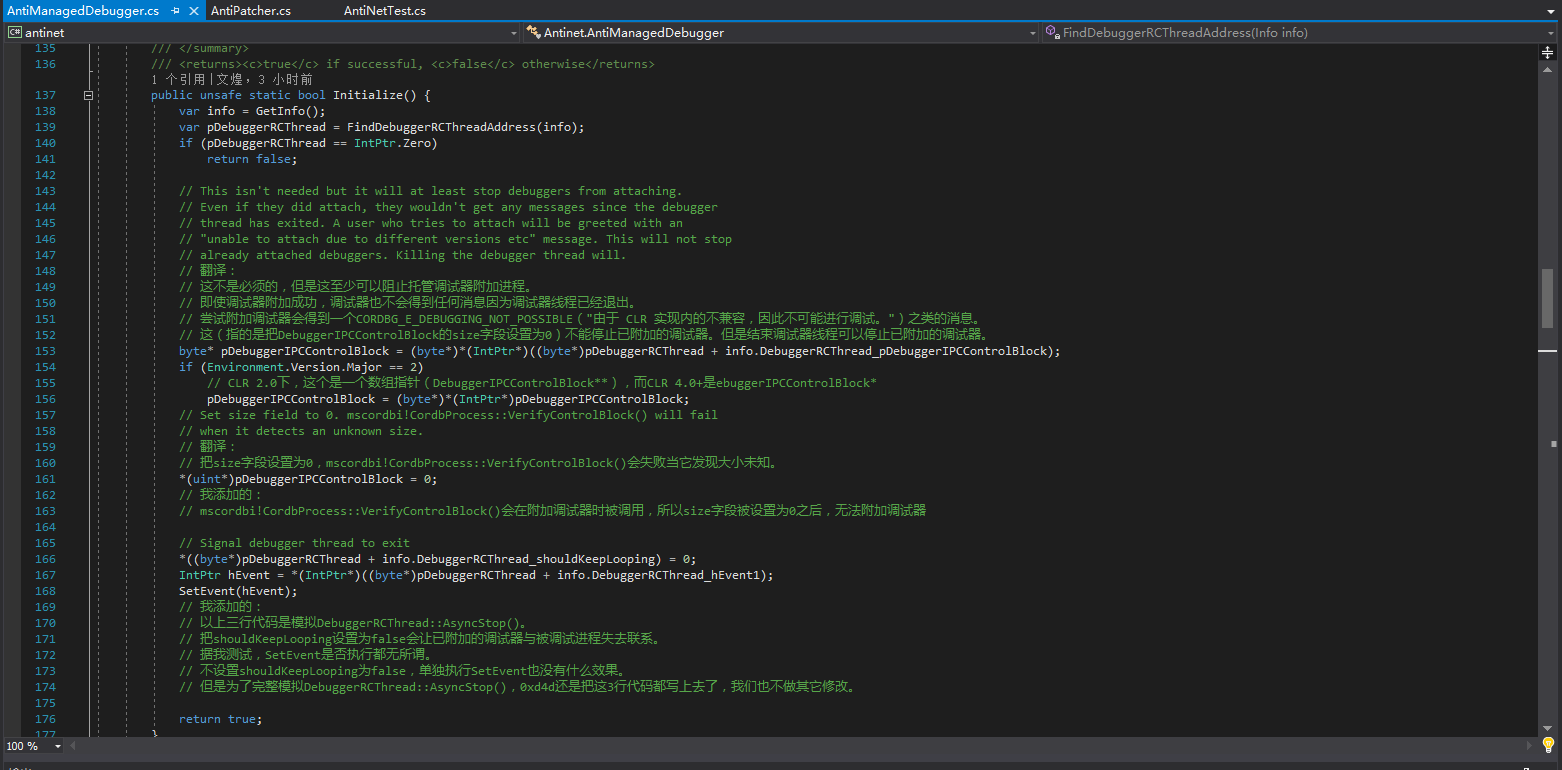
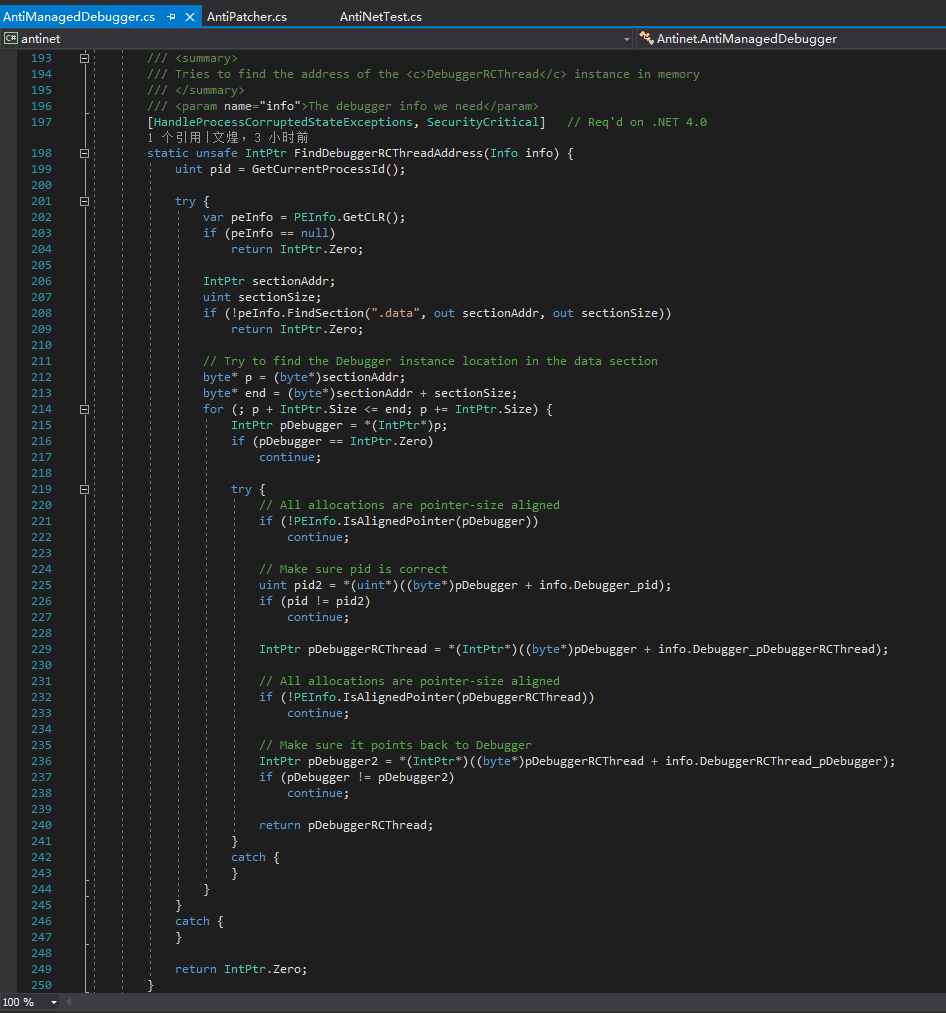
The meaning of the code is exactly the same as 0xd4d’s own explanation, and they can be compared with each other. We won’t discuss the principle and idea of ending the debugging thread here; let’s take a closer look at what fields 0xd4d operated on.

Learn More in CLR Source Code

If I remember correctly, CoreCLR was open-sourced on the CLR v4.6 branch. Therefore, CLR v4.5 and later versions, as well as CoreCLR, are similar, and viewing the source code of CoreCLR is much better than IDA decompilation. However, CLR v4.0 is somewhere between CLR v2.0 and CLR v4.5; it can be regarded as a four-like system, which we will ignore for now because except for XP, all other systems can install .NET 4.5, and almost all of them have installed the latest .NET Framework.

SSCLI20 corresponds to CLR v2.0, which is .NET 2.0~3.5. Sometimes, it is better to view the SSCLI20 code than the IDA decompiled code of CLR v2.0.

Didn’t 0xd4d mention the “keep-looping” field? Let’s search for it in CoreCLR, and you will find that it cannot be found.

Did 0xd4d make a mistake? Or is CoreCLR different? Of course not, as a large-scale project, many parts of CLR cannot be changed easily. Let’s carefully search the declaration of DebuggerRCThread class, and you will find a field called “m_run”, which is the “keep-looping” field 0xd4d mentioned.

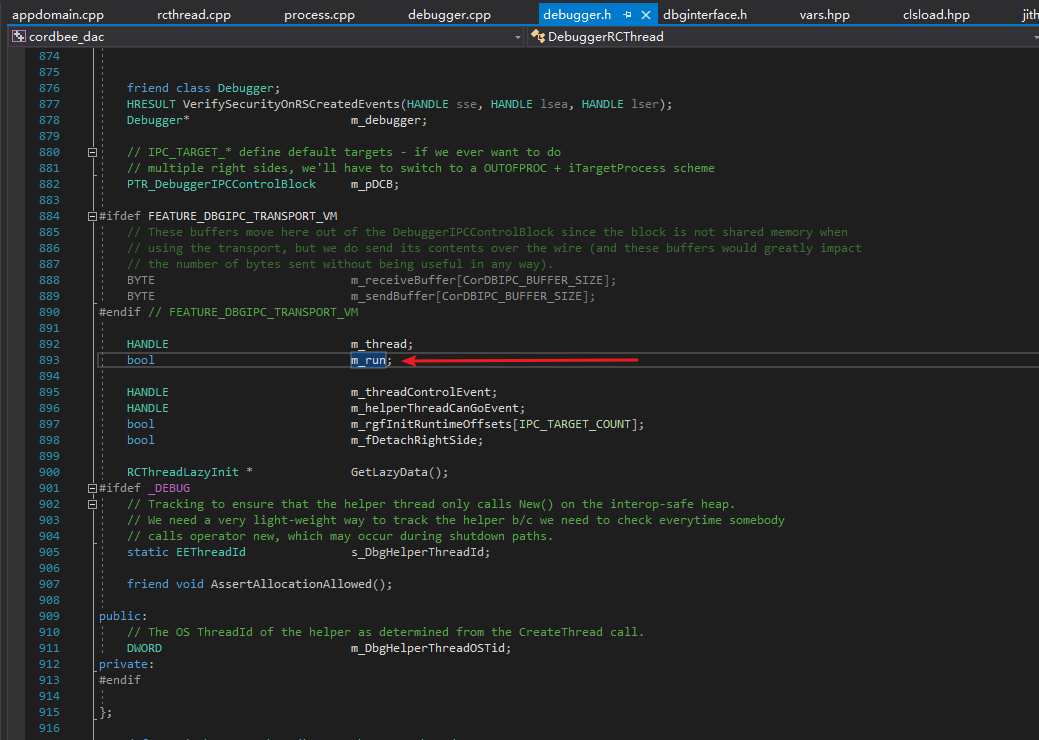
Now that we have found the “m_run” field, let’s take a look at what statement corresponds to the comment in AntiManagedDebugger.Initialize() that says “Signal debugger thread to exit”.

1
2
3
4
5
6
7
8
9
10
// Signal debugger thread to exit
*((byte*)pDebuggerRCThread + info.DebuggerRCThread_shouldKeepLooping) = 0;
IntPtr hEvent = *(IntPtr*)((byte*)pDebuggerRCThread + info.DebuggerRCThread_hEvent1);
SetEvent(hEvent);
// I added:
// The above three lines of code simulate DebuggerRCThread::AsyncStop().
// Setting shouldKeepLooping to false will cause the attached debugger to lose contact with the debugged process.
// According to my testing, it doesn't matter whether SetEvent is executed or not.
// Not setting shouldKeepLooping to false and executing SetEvent alone has no effect.
// But in order to fully simulate DebuggerRCThread::AsyncStop(), 0xd4d still wrote all these three lines of code, and we don't make any other modifications.

In CoreCLR, we select the m_run field and click “Find All References” to quickly locate the function “HRESULT DebuggerRCThread::AsyncStop(void)”.

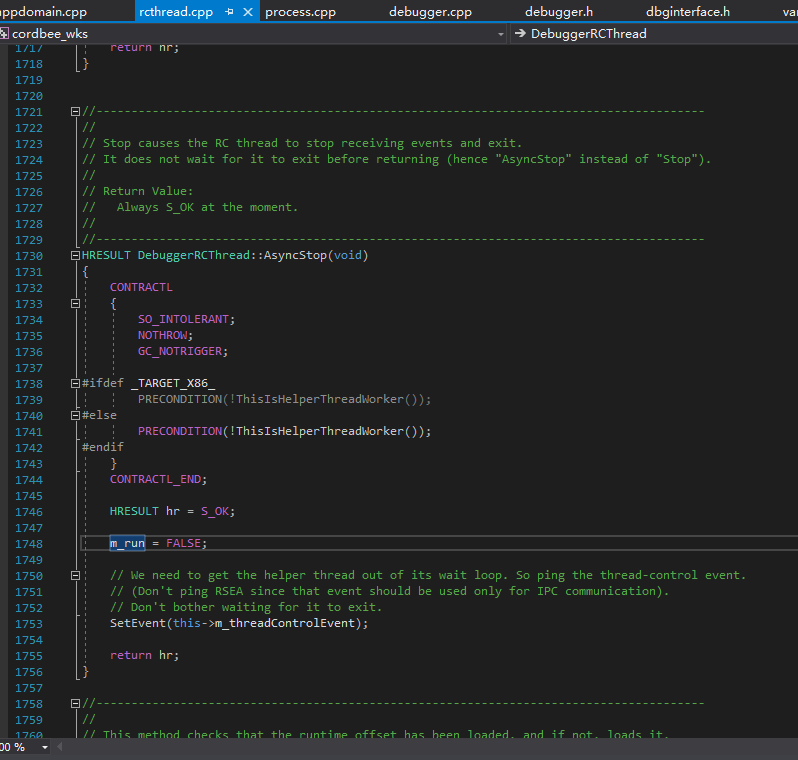
In this way, we understand that this piece of code is simulating DebuggerRCThread::AsyncStop(), which is called by Debugger::StopDebugger(), so it can achieve the goal of ending an existing debugger.

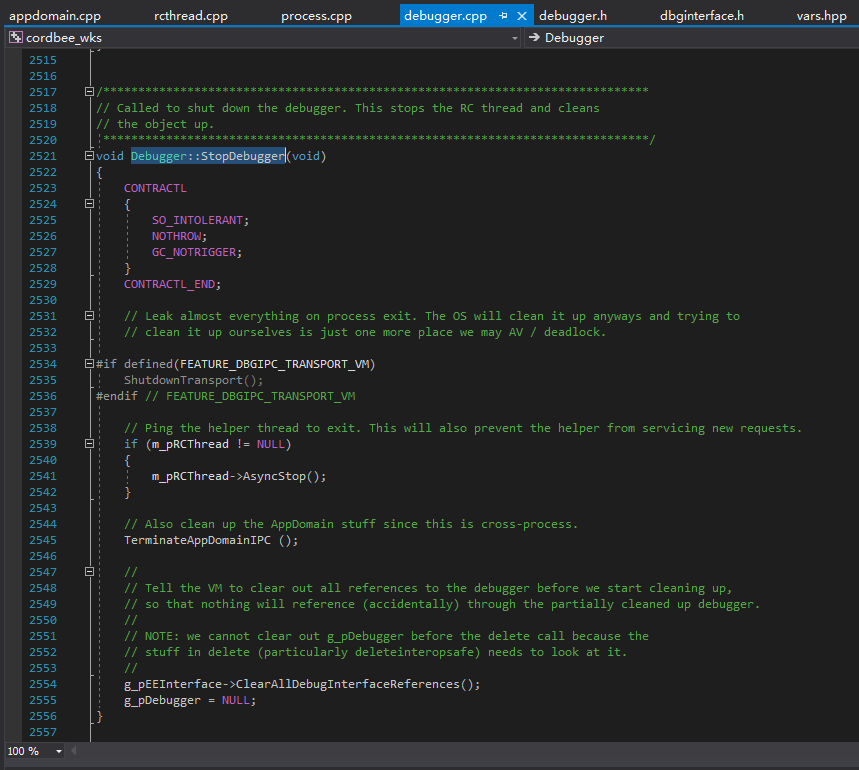
Of course, this cannot prevent a managed debugger from re-attaching to the current process. Therefore, before that, we need to prevent the managed debugger from attaching to the current process. That’s the meaning of the following code:

1
2
3
4
5
6
7
8
9
10
11
12
13
14
// This isn't needed but it will at least stop debuggers from attaching.
// Even if they did attach, they wouldn't get any messages since the debugger
// thread has exited. A user who tries to attach will be greeted with an
// "unable to attach due to different versions etc" message. This will not stop
// already attached debuggers. Killing the debugger thread will.
byte* pDebuggerIPCControlBlock = (byte*)*(IntPtr*)((byte*)pDebuggerRCThread + info.DebuggerRCThread_pDebuggerIPCControlBlock);
if (Environment.Version.Major == 2)
// Under CLR 2.0, this is an array of pointers (DebuggerIPCControlBlock**) while under CLR 4.0+ it's DebuggerIPCControlBlock*
pDebuggerIPCControlBlock = (byte*)*(IntPtr*)pDebuggerIPCControlBlock;
// Set size field to 0. mscordbi!CordbProcess::VerifyControlBlock() will fail
// when it detects an unknown size.
*(uint*)pDebuggerIPCControlBlock = 0;
// I added:
// CordbProcess::VerifyControlBlock() in mscordbi! will be called when a debugger is attached, so after setting the size field to 0, the debugger cannot be attached.

We directly go to CordbProcess::VerifyControlBlock() in CoreCLR to see what kind of verification it has.

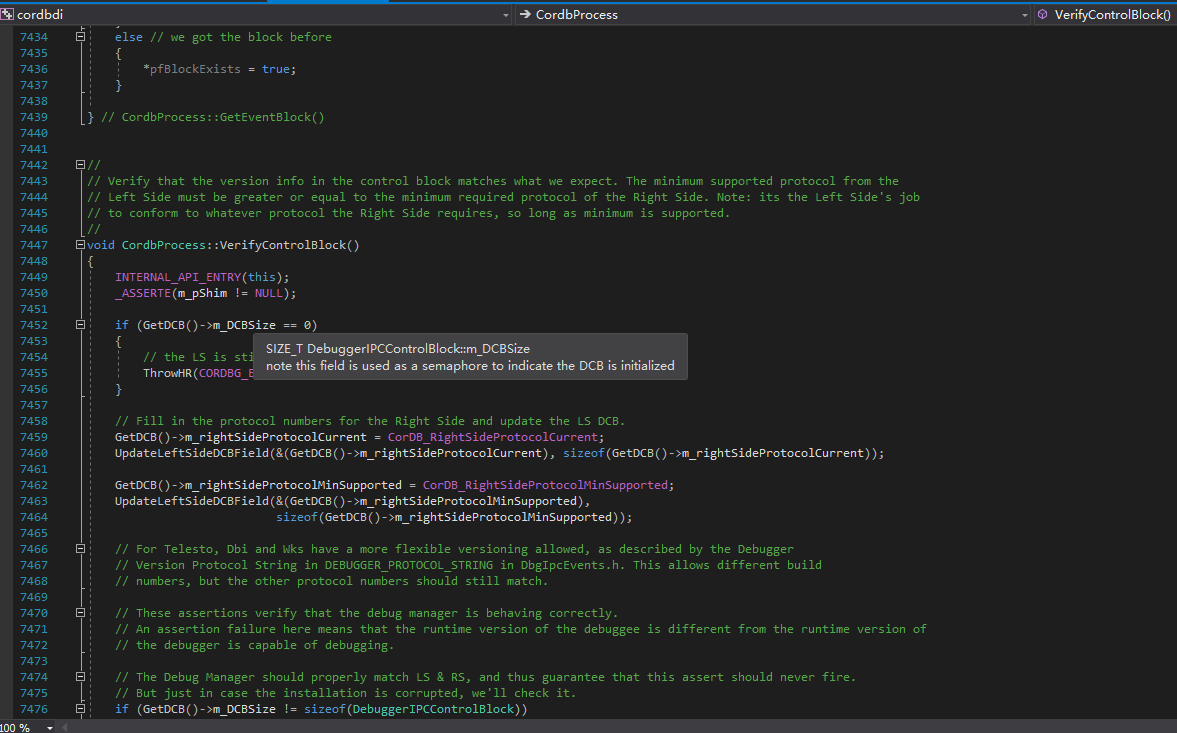
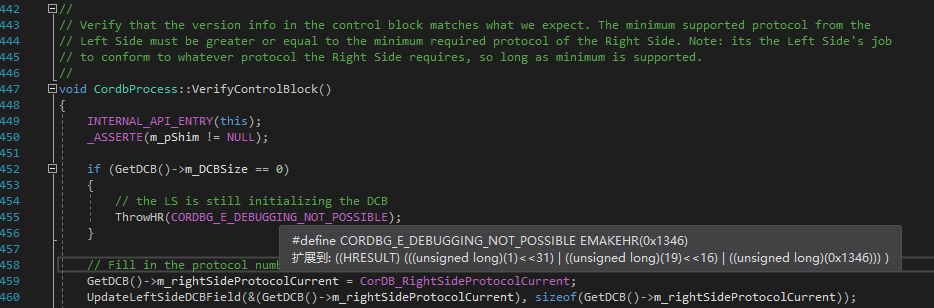
Let’s also take a look at where m_DCBSize is defined and how to obtain it.

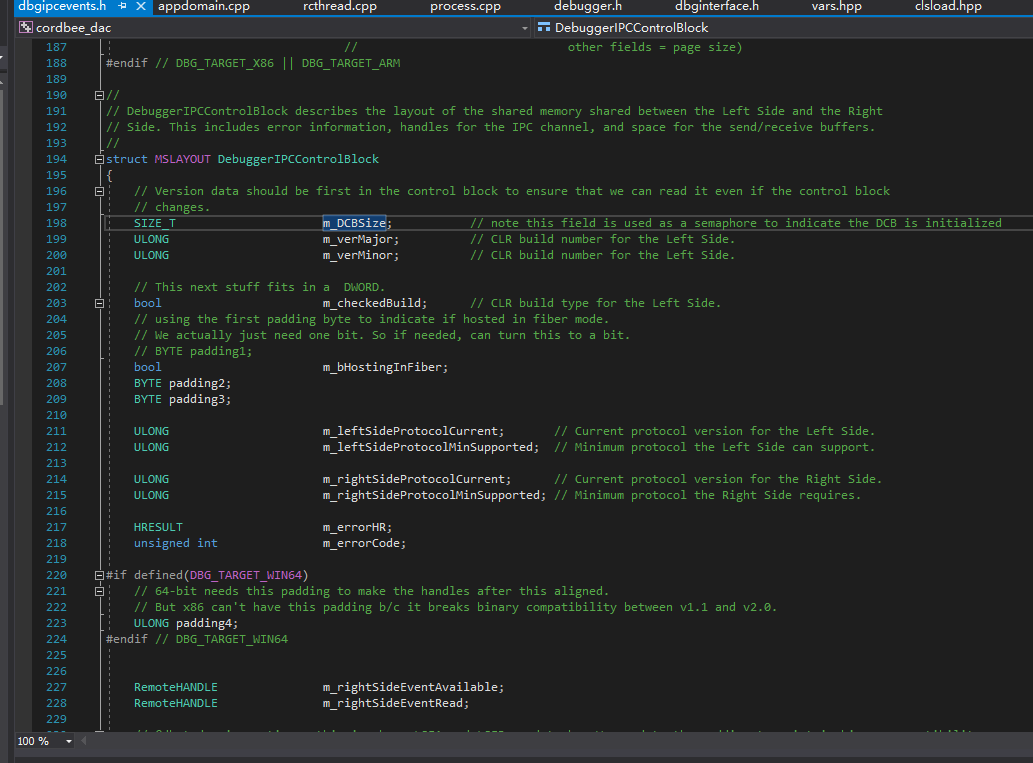
The code at 0xd4d checks if the version is .NET 2.0~3.5. After studying it, we can find some reasons through SSCLI20.

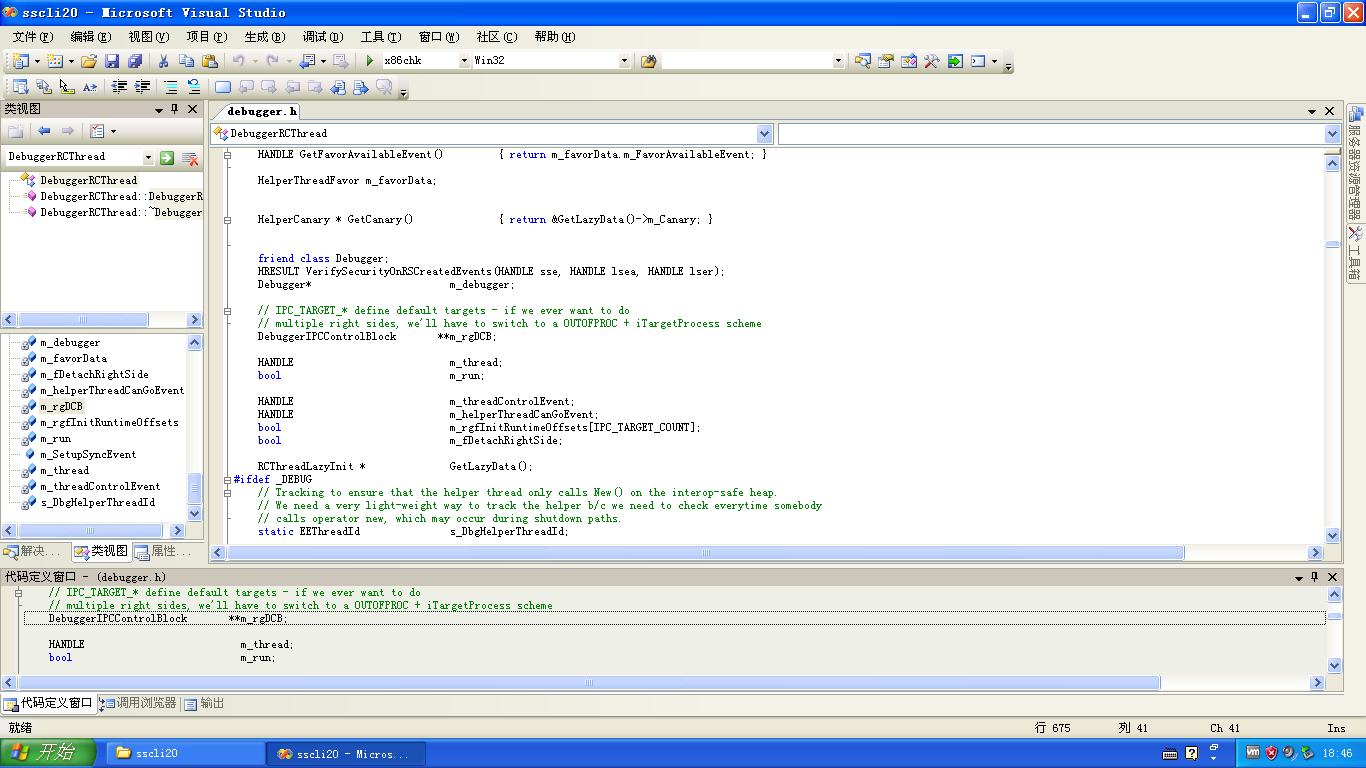
First, let’s open the SSCLI20 source code. In the class view, search for DebuggerRCThread and find the field m_rgDCB, which corresponds to the previous m_pDCB, but has an additional level of pointer.

Anti-anti-debugging

The code at 0xd4d obtains the address of the .data section through memory, and we can directly modify the section header to achieve anti-anti-debugging.

So we have many ways to bypass this anti-anti-debugging, such as:

  • If the .data section does not exist, exit the process directly, because theoretically the .data section must exist.
  • Read the RVA and Size of the .data section directly from the file, and then scan the corresponding position in memory.
  • Verify if the PE header has been modified. If it has been modified, exit the process directly.

Among them, verifying the PE header is the most effective method. Why? Since we cannot directly delete the .data feature, we can forge a fake section header, let AntiManagedDebugger modify somewhere else instead of the real DebuggerRCThread instance. If we ensure that the PE header is consistent with the one in the file, then we can determine that we have found the real and valid DebuggerRCThread instance through the .data section.

This anti-anti-debugging method is very easy to be detected again, so can we just directly modify all the places where this global variable is referenced? The answer is no. I have done various tests, such as directly copying objects, modifying before or after DllMain, all of which cause problems with the debugger.

These codes were written a long time ago, and I don’t want to test them again. This method is extremely troublesome, so it’s better to directly find the anti-debugging location and patch it.

Improved Antinet

AntiPatcher

Since there are some minor weaknesses in 0xd4d’s AntiManagedDebugger, we can add an AntiPatcher class to fix them.

This AntiPatcher class should be able to verify whether the PE header of the CLR module has been modified.

1
2
3
4
5
6
7
8
9
10
11
12
13
14
15
16
17
18
19
20
21
22
23
24
25
26
27
28
29
30
31
32
33
34
35
36
37
38
39
40
41
42
43
44
45
46
47
48
49
50
51
52
53
54
55
56
57
58
59
60
61
62
63
64
65
66
67
68
69
70
71
72
73
private static void* _clrModuleHandle;
private static uint _clrPEHeaderCrc32Original;
private static bool _isInitialized;

private static void Initialize() {
StringBuilder stringBuilder;
byte[] clrFile;

if (_isInitialized)
return;
switch (Environment.Version.Major) {
case 2:
_clrModuleHandle = GetModuleHandle("mscorwks.dll");
break;
case 4:
_clrModuleHandle = GetModuleHandle("clr.dll");
break;
default:
throw new NotSupportedException();
}
if (_clrModuleHandle == null)
throw new InvalidOperationException();
stringBuilder = new StringBuilder((int)MAX_PATH);
if (!GetModuleFileName(_clrModuleHandle, stringBuilder, MAX_PATH))
throw new InvalidOperationException();
clrFile = File.ReadAllBytes(stringBuilder.ToString());
fixed (byte* pPEImage = clrFile)
_clrPEHeaderCrc32Original = DynamicCrc32.Compute(CopyPEHeader(pPEImage));
_isInitialized = true;
}

private static byte[] CopyPEHeader(void* pPEImage) {
uint imageBaseOffset;
uint length;
byte[] peHeader;

GetPEInfo(pPEImage, out imageBaseOffset, out length);
peHeader = new byte[length];
fixed (byte* pPEHeader = peHeader) {
for (uint i = 0; i < length; i++)
pPEHeader[i] = ((byte*)pPEImage)[i];
// Copy PE Headers
*(void**)(pPEHeader + imageBaseOffset) = null;
// Exclude the ImageBase field of the optional header, which will change and cannot be used for verification.
}
return peHeader;
}

private static void GetPEInfo(void* pPEImage, out uint imageBaseOffset, out uint length) {
byte* p;
ushort optionalHeaderSize;
bool isPE32;
uint sectionsCount;
void* pSectionHeaders;

p = (byte*)pPEImage;
p += *(uint*)(p + 0x3C);
// NtHeader
p += 4 + 2;
// Skip Signature + Machine
sectionsCount = *(ushort*)p;
p += 2 + 4 + 4 + 4;
// Skip NumberOfSections + TimeDateStamp + PointerToSymbolTable + NumberOfSymbols
optionalHeaderSize = *(ushort*)p;
p += 2 + 2;
// Skip SizeOfOptionalHeader + Characteristics
isPE32 = *(ushort*)p == 0x010B;
imageBaseOffset = isPE32 ? (uint)(p + 0x1C - (byte*)pPEImage) : (uint)(p + 0x18 - (byte*)pPEImage);
p += optionalHeaderSize;
// Skip OptionalHeader
pSectionHeaders = (void*)p;
length = (uint)((byte*)pSectionHeaders + 0x28 * sectionsCount - (byte*)pPEImage);
}

Call Initialize() to get the CRC32 from the file.

Let’s write another method to verify whether there is such a PE header in memory.

1
2
3
4
5
6
7
/// <summary>
/// Check whether the PE header of the CLR module has been modified.
/// </summary>
/// <returns>If it is modified, return <see langword="true"/></returns>
public static bool VerifyClrPEHeader() {
return DynamicCrc32.Compute(CopyPEHeader(_clrModuleHandle)) != _clrPEHeaderCrc32Original;
}

AntiDebugger

Firstly, this class should have the same function as the original AntiManagedDebugger, so we don’t delete the AntiManagedDebugger class, but wrap it directly.

1
2
3
4
5
6
7
8
9
10
11
12
private static bool _isManagedDebuggerPrevented;

/// <summary>
/// Prevent managed debugger from debugging the current process.
/// </summary>
/// <returns></returns>
public static bool PreventManagedDebugger() {
if (_isManagedDebuggerPrevented)
return true;
_isManagedDebuggerPrevented = AntiManagedDebugger.Initialize();
return _isManagedDebuggerPrevented;
}

Then we add a method to detect non-managed and managed debuggers.

1
2
3
4
5
6
7
8
/// <summary>
/// Checking whether any type of debugger exists.
/// </summary>
/// <returns></returns>
public static bool HasDebugger() {
return HasUnmanagedDebugger() || HasManagedDebugger();
// Checking whether an unmanaged debugger exists is faster and more efficient, and can also detect managed debuggers under CLR40.
}

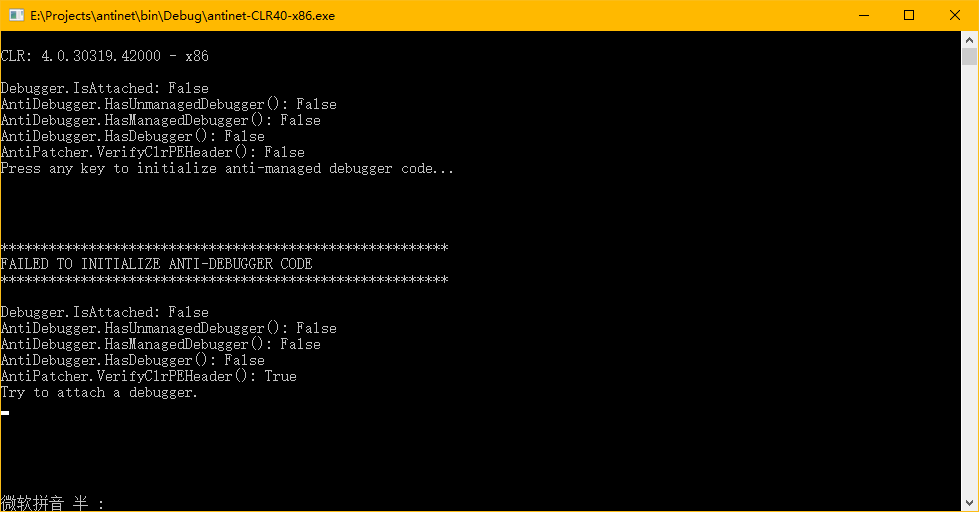
The implementation of HasUnmanagedDebugger is simple. We just need to delete the syscall part of xjun’s XAntiDebug. It takes some time to convert the syscall exploit code into C# code, so we will do it later. After all, debugging .NET programs using a non-managed debugger is extremely painful. Our anti-debugging target should mainly be managed debuggers such as dnSpy.

1
2
3
4
5
6
7
8
9
10
11
12
13
14
15
16
17
18
19
20
21
22
23
/// <summary>
/// Check whether an unmanaged debugger exists.
/// When using a managed debugger to debug a process under CLR20, this method returns <see langword="false"/> because CLR20 does not use the Win32 debugging interface, and Win32 functions cannot detect the debugger.
/// When using a managed debugger to debug a process under CLR40, this method returns <see langword="true"/>.
/// </summary>
/// <returns></returns>
public static bool HasUnmanagedDebugger() {
bool isDebugged;

if (IsDebuggerPresent())
return true;
if (!CheckRemoteDebuggerPresent(GetCurrentProcess(), &isDebugged))
return true;
if (isDebugged)
return true;
try {
CloseHandle((void*)0xDEADC0DE);
}
catch {
return true;
}
return false;
}

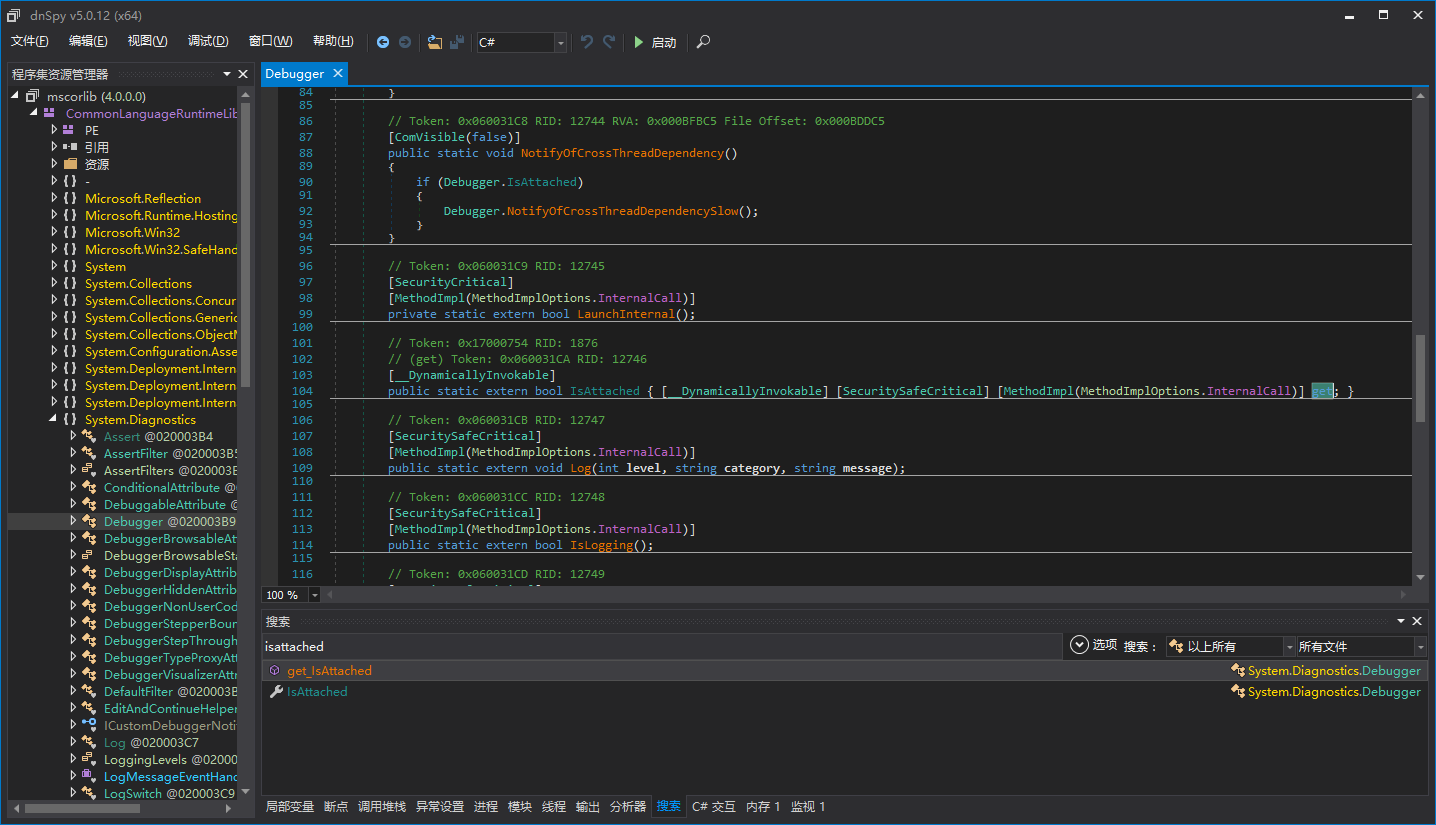
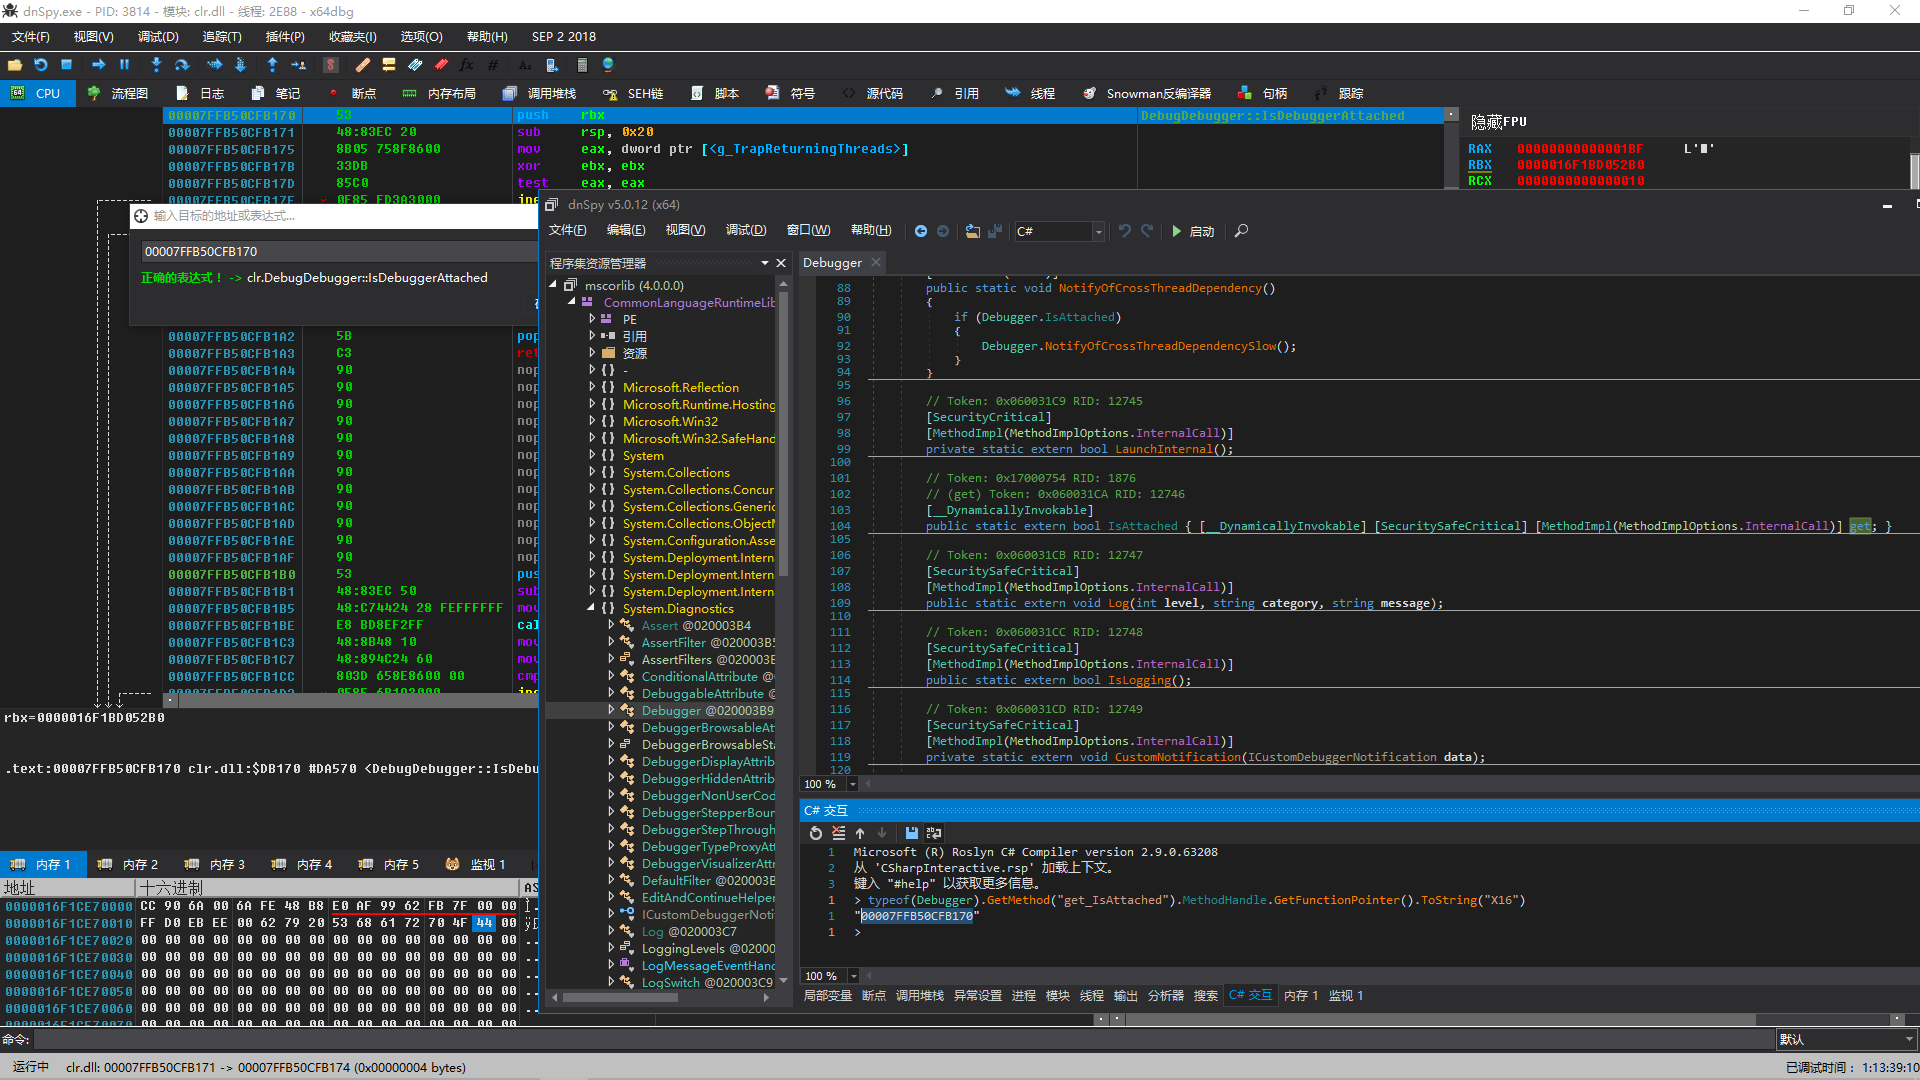
Next is the implementation of HasManagedDebugger(), which is the main event. The most effective and convenient way to detect a managed debugger is to call Debugger.IsAttached. Unfortunately, this is too easy to modify, so we check whether it has been modified. A good news is that the implementation of Debugger.IsAttached is actually inside CLR and is a [MethodImpl(MethodImplOptions.InternalCall)], which means that the native code address of this method is the address of a function in the CLR module. As for why it is like this, it is not the focus of this article, so it will not be explained here. You can study CoreCLR by yourself.

We add initialization code to directly read the original code from clr.dll/mscorwks.dll and calculate its CRC32.

1
2
3
4
5
6
7
8
9
10
11
12
13
14
15
16
17
18
19
20
21
22
23
24
25
26
27
28
29
30
31
32
33
34
35
36
37
38
39
40
41
42
43
44
45
46
47
48
49
50
51
52
53
54
55
56
57
58
59
60
61
62
63
64
65
66
67
68
69
70
71
72
73
74
75
76
77
78
79
80
81
82
83
private delegate bool IsDebuggerAttachedDelegate();

private static bool _isManagedDebuggerPrevented;
private static bool _isManagedInitialized;
private static byte* _pIsDebuggerAttached;
private static IsDebuggerAttachedDelegate _isDebuggerAttached;
private static uint _isDebuggerAttachedLength;
private static uint _isDebuggerAttachedCrc32;

private static void InitializeManaged() {
void* clrModuleHandle;
StringBuilder stringBuilder;
byte[] clrFile;

if (_isManagedInitialized)
return;
switch (Environment.Version.Major) {
case 2:
_pIsDebuggerAttached = (byte*)typeof(Debugger).GetMethod("IsDebuggerAttached", BindingFlags.NonPublic | BindingFlags.Static).MethodHandle.GetFunctionPointer();
// Unlike .NET 4.x, the get property of Debugger.IsAttached calls IsDebuggerAttached() instead of going directly to CLR internals.
clrModuleHandle = GetModuleHandle("mscorwks.dll");
break;
case 4:
_pIsDebuggerAttached = (byte*)typeof(Debugger).GetMethod("get_IsAttached").MethodHandle.GetFunctionPointer();
// The get property of Debugger.IsAttached is a method with the [MethodImpl(MethodImplOptions.InternalCall)] attribute, meaning that its implementation is inside CLR, and there are no stubs, directly pointing to CLR internals.
// Through debugging with x64dbg, we can know that Debugger.get_IsAttached() corresponds to clr!DebugDebugger::IsDebuggerAttached().
clrModuleHandle = GetModuleHandle("clr.dll");
break;
default:
throw new NotSupportedException();
}
_isDebuggerAttached = (IsDebuggerAttachedDelegate)Marshal.GetDelegateForFunctionPointer((IntPtr)_pIsDebuggerAttached, typeof(IsDebuggerAttachedDelegate));
if (clrModuleHandle == null)
throw new InvalidOperationException();
stringBuilder = new StringBuilder((int)MAX_PATH);
if (!GetModuleFileName(clrModuleHandle, stringBuilder, MAX_PATH))
throw new InvalidOperationException();
clrFile = File.ReadAllBytes(stringBuilder.ToString());
// Read the bytes of the CLR module file.
fixed (byte* pPEImage = clrFile) {
PEInfo peInfo;
uint isDebuggerAttachedRva;
uint isDebuggerAttachedFoa;
byte* pCodeStart;
byte* pCodeCurrent;
ldasm_data ldasmData;
bool is64Bit;
byte[] opcodes;

peInfo = new PEInfo(pPEImage);
isDebuggerAttachedRva = (uint)(_pIsDebuggerAttached - (byte*)clrModuleHandle);
isDebuggerAttachedFoa = peInfo.ToFOA(isDebuggerAttachedRva);
pCodeStart = pPEImage + isDebuggerAttachedFoa;
pCodeCurrent = pCodeStart;
is64Bit = sizeof(void*) == 8;
opcodes = new byte[0x200];
// Allocate memory far greater than the actual function size.
while (true) {
uint length;

length = Ldasm.ldasm(pCodeCurrent, &ldasmData, is64Bit);
if ((ldasmData.flags & Ldasm.F_INVALID) != 0)
throw new NotSupportedException();
CopyOpcode(&ldasmData, pCodeCurrent, opcodes, (uint)(pCodeCurrent - pCodeStart));
if (*pCodeCurrent == 0xC3) {
// Find the first ret instruction.
pCodeCurrent += length;
break;
}
pCodeCurrent += length;
}
// Copy the Opcode until the first ret appears.
_isDebuggerAttachedLength = (uint)(pCodeCurrent - pCodeStart);
fixed (byte* pOpcodes = opcodes)
_isDebuggerAttachedCrc32 = DynamicCrc32.Compute(pOpcodes, _isDebuggerAttachedLength);
}
_isManagedInitialized = true;
}

private static void CopyOpcode(ldasm_data* pLdasmData, void* pCode, byte[] opcodes, uint offset) {
for (byte i = 0; i < pLdasmData->opcd_size; i++)
opcodes[offset + pLdasmData->opcd_offset + i] = ((byte*)pCode)[pLdasmData->opcd_offset + i];
}

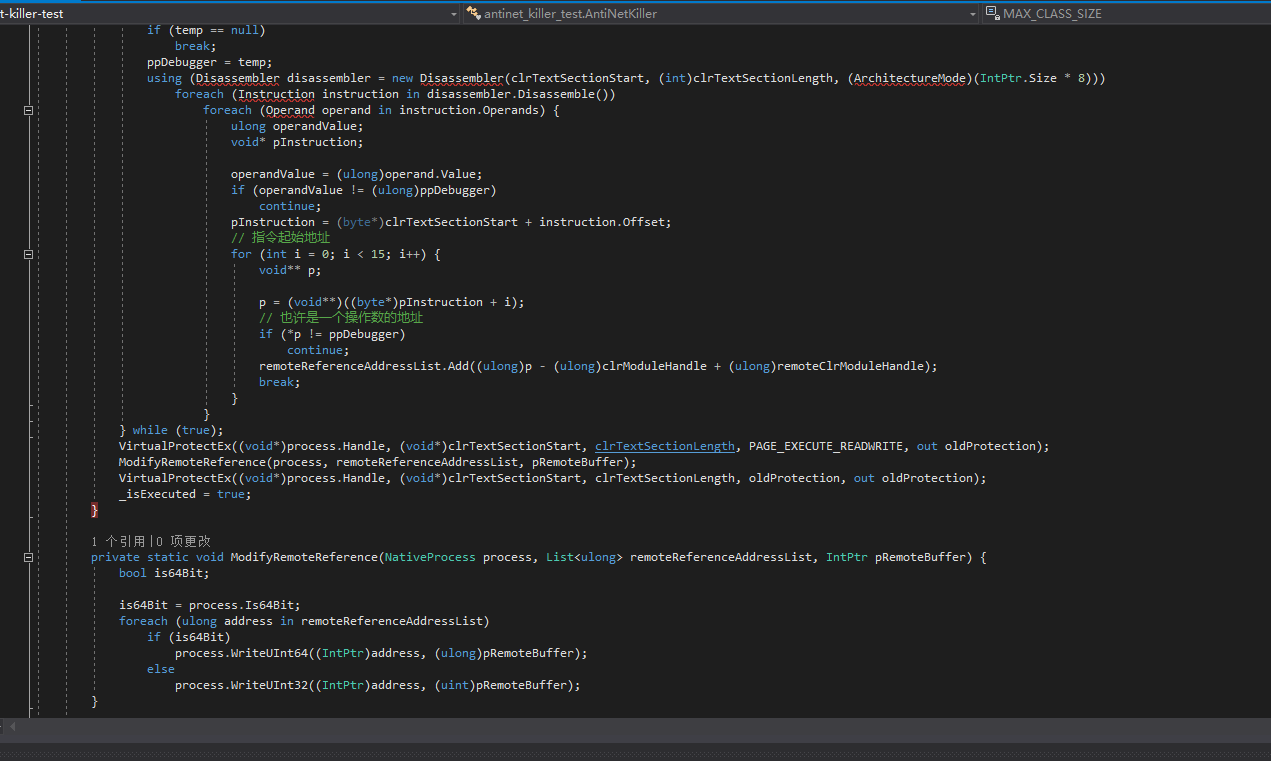
Here we used Ldasm, which I learned from xjun’s XAntiDebug project. This disassembly engine is very small, really only one function, and I attach the C# code translated by me.

1
2
3
4
5
6
7
8
9
10
11
12
13
14
15
16
17
18
19
20
21
22
23
24
25
26
27
28
29
30
31
32
33
34
35
36
37
38
39
40
41
42
43
44
45
46
47
48
49
50
51
52
53
54
55
56
57
58
59
60
61
62
63
64
65
66
67
68
69
70
71
72
73
74
75
76
77
78
79
80
81
82
83
84
85
86
87
88
89
90
91
92
93
94
95
96
97
98
99
100
101
102
103
104
105
106
107
108
109
110
111
112
113
114
115
116
117
118
119
120
121
122
123
124
125
126
127
128
129
130
131
132
133
134
135
136
137
138
139
140
141
142
143
144
145
146
147
148
149
150
151
152
153
154
155
156
157
158
159
160
161
162
163
164
165
/// <summary>
/// Disassemble one instruction
/// </summary>
/// <param name="code">pointer to the code for disassemble</param>
/// <param name="ld">pointer to structure ldasm_data</param>
/// <param name="is64">set this flag for 64-bit code, and clear for 32-bit</param>
/// <returns>length of instruction</returns>
public static uint ldasm(void* code, ldasm_data* ld, bool is64) {
byte* p = (byte*)code;
byte s, op, f;
byte rexw, pr_66, pr_67;

s = rexw = pr_66 = pr_67 = 0;

/* dummy check */
if (code == null || ld == null)
return 0;

/* init output data */
*ld = new ldasm_data();

/* phase 1: parse prefixies */
while ((cflags(*p) & OP_PREFIX) != 0) {
if (*p == 0x66)
pr_66 = 1;
if (*p == 0x67)
pr_67 = 1;
p++; s++;
ld->flags |= F_PREFIX;
if (s == 15) {
ld->flags |= F_INVALID;
return s;
}
}

/* parse REX prefix */
if (is64 && *p >> 4 == 4) {
ld->rex = *p;
rexw = (byte)((ld->rex >> 3) & 1);
ld->flags |= F_REX;
p++; s++;
}

/* can be only one REX prefix */
if (is64 && *p >> 4 == 4) {
ld->flags |= F_INVALID;
s++;
return s;
}

/* phase 2: parse opcode */
ld->opcd_offset = (byte)(p - (byte*)code);
ld->opcd_size = 1;
op = *p++; s++;

/* is 2 byte opcode? */
if (op == 0x0F) {
op = *p++; s++;
ld->opcd_size++;
f = cflags_ex(op);
if ((f & OP_INVALID) != 0) {
ld->flags |= F_INVALID;
return s;
}
/* for SSE instructions */
if ((f & OP_EXTENDED) != 0) {
op = *p++; s++;
ld->opcd_size++;
}
}
else {
f = cflags(op);
/* pr_66 = pr_67 for opcodes A0-A3 */
if (op >= 0xA0 && op <= 0xA3)
pr_66 = pr_67;
}

/* phase 3: parse ModR/M, SIB and DISP */
if ((f & OP_MODRM) != 0) {
byte mod = (byte)(*p >> 6);
byte ro = (byte)((*p & 0x38) >> 3);
byte rm = (byte)(*p & 7);

ld->modrm = *p++; s++;
ld->flags |= F_MODRM;

/* in F6,F7 opcodes immediate data present if R/O == 0 */
if (op == 0xF6 && (ro == 0 || ro == 1))
f |= OP_DATA_I8;
if (op == 0xF7 && (ro == 0 || ro == 1))
f |= OP_DATA_I16_I32_I64;

/* is SIB byte exist? */
if (mod != 3 && rm == 4 && !(!is64 && pr_67 != 0)) {
ld->sib = *p++; s++;
ld->flags |= F_SIB;

/* if base == 5 and mod == 0 */
if ((ld->sib & 7) == 5 && mod == 0) {
ld->disp_size = 4;
}
}

switch (mod) {
case 0:
if (is64) {
if (rm == 5) {
ld->disp_size = 4;
if (is64)
ld->flags |= F_RELATIVE;
}
}
else if (pr_67 != 0) {
if (rm == 6)
ld->disp_size = 2;
}
else {
if (rm == 5)
ld->disp_size = 4;
}
break;
case 1:
ld->disp_size = 1;
break;
case 2:
if (is64)
ld->disp_size = 4;
else if (pr_67 != 0)
ld->disp_size = 2;
else
ld->disp_size = 4;
break;
}

if (ld->disp_size != 0) {
ld->disp_offset = (byte)(p - (byte*)code);
p += ld->disp_size;
s += ld->disp_size;
ld->flags |= F_DISP;
}
}

/* phase 4: parse immediate data */
if (rexw != 0 && (f & OP_DATA_I16_I32_I64) != 0)
ld->imm_size = 8;
else if ((f & OP_DATA_I16_I32) != 0 || (f & OP_DATA_I16_I32_I64) != 0)
ld->imm_size = (byte)(4 - (pr_66 << 1));

/* if exist, add OP_DATA_I16 and OP_DATA_I8 size */
ld->imm_size += (byte)(f & 3);

if (ld->imm_size != 0) {
s += ld->imm_size;
ld->imm_offset = (byte)(p - (byte*)code);
ld->flags |= F_IMM;
if ((f & OP_RELATIVE) != 0)
ld->flags |= F_RELATIVE;
}

/* instruction is too long */
if (s > 15)
ld->flags |= F_INVALID;

return s;
}

There are also a bunch of definitions that you can go to antinet to see for yourself. I won’t paste them here.

At this point, we can add code to check whether a managed debugger exists.

1
2
3
4
5
6
7
8
9
10
11
12
13
14
15
16
17
18
19
20
21
22
23
24
25
26
27
28
29
30
31
32
33
34
35
36
37
38
39
40
41
42
43
44
/// <summary>
/// Use clr!DebugDebugger::IsDebuggerAttached() to check whether a managed debugger exists.
/// Note that this method cannot detect the existence of an unmanaged debugger (such as OllyDbg, x64dbg).
/// </summary>
/// <returns></returns>
public static bool HasManagedDebugger() {
byte[] opcodes;
byte* pCodeStart;
byte* pCodeCurrent;
byte* pCodeEnd;
ldasm_data ldasmData;
bool is64Bit;

InitializeManaged();
if (_isDebuggerAttached())
// At this point, there must be a managed debugger attached.
return true;
// At this point, it cannot be ensured that the managed debugger has not debugged the current process.
if (_pIsDebuggerAttached[0] == 0x33 && _pIsDebuggerAttached[1] == 0xC0 && _pIsDebuggerAttached[2] == 0xC3)
// This is the feature of dnSpy's anti-anti-debugging.
return true;
// It is possible that the feature has changed, further verification is needed.
opcodes = new byte[_isDebuggerAttachedLength];
pCodeStart = _pIsDebuggerAttached;
pCodeCurrent = pCodeStart;
pCodeEnd = _pIsDebuggerAttached + _isDebuggerAttachedLength;
is64Bit = sizeof(void*) == 8;
while (true) {
uint length;

length = Ldasm.ldasm(pCodeCurrent, &ldasmData, is64Bit);
if ((ldasmData.flags & Ldasm.F_INVALID) != 0)
throw new NotSupportedException();
CopyOpcode(&ldasmData, pCodeCurrent, opcodes, (uint)(pCodeCurrent - pCodeStart));
pCodeCurrent += length;
if (pCodeCurrent == pCodeEnd)
break;
}
// Copy Opcodes.
if (DynamicCrc32.Compute(opcodes) != _isDebuggerAttachedCrc32)
// If the CRC32 are not equal, then CLR may have been patched.
return true;
return false;
}

Some may wonder why we don’t just copy the machine code to the buffer for verification, but only take the Opcode. This is because we need to consider the existence of relocation tables, so we can only detect whether the Opcode has been modified. It’s a bit complicated to check whether the operands have been modified.

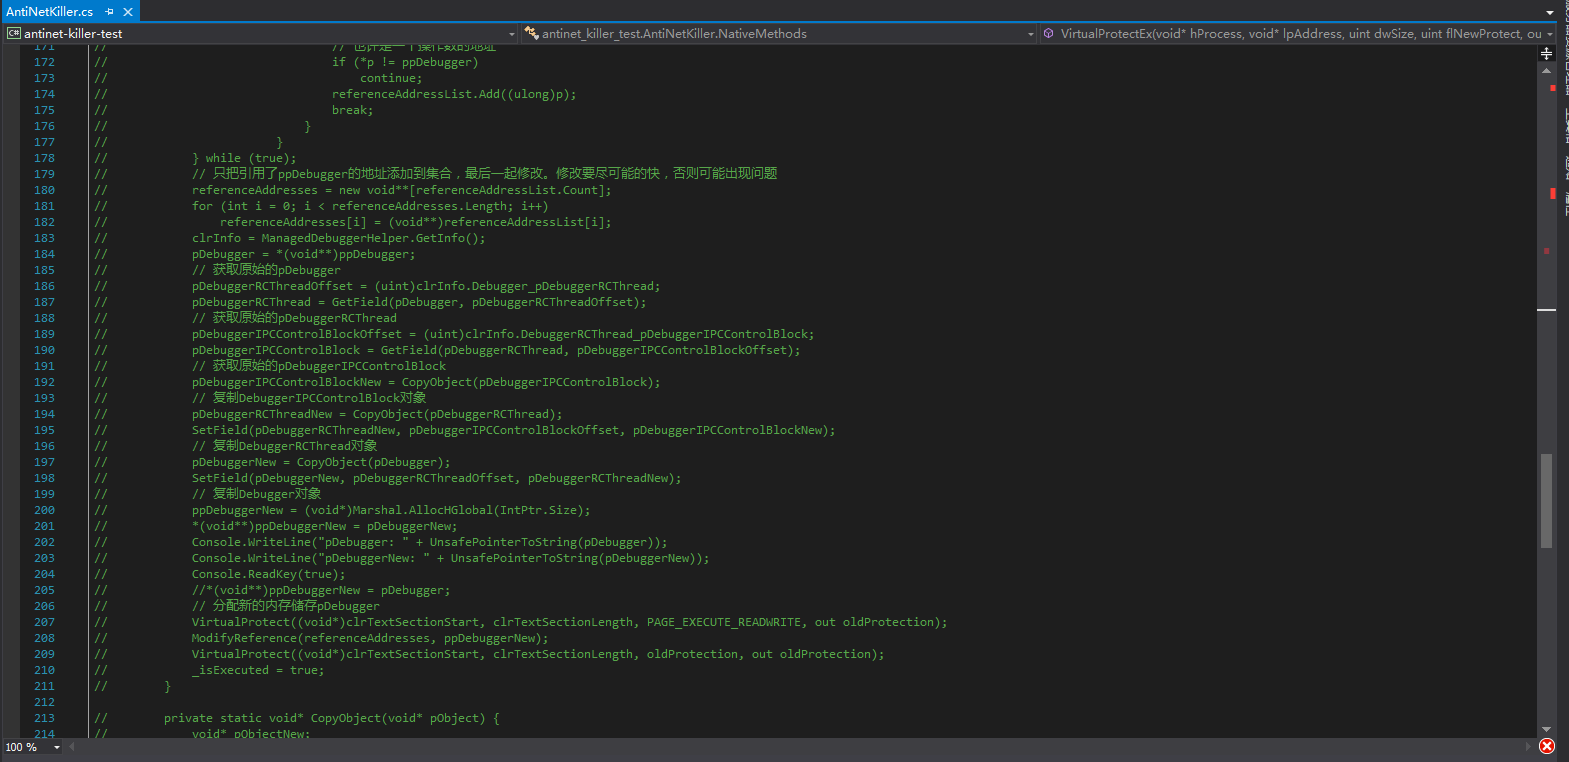
Previously, we considered verifying the .text section of the entire CLR, but it failed. You can go to my GitHub commit history to see this part of the code. It is in AntiPatcher.cs and was commented out because it failed.

Why use

1
2
3
if (_isDebuggerAttached())
// At this point, there must be a managed debugger attached.
return true;

instead of

1
2
3
if (Debugger.IsAttched)
// At this point, there must be a managed debugger attached.
return true;

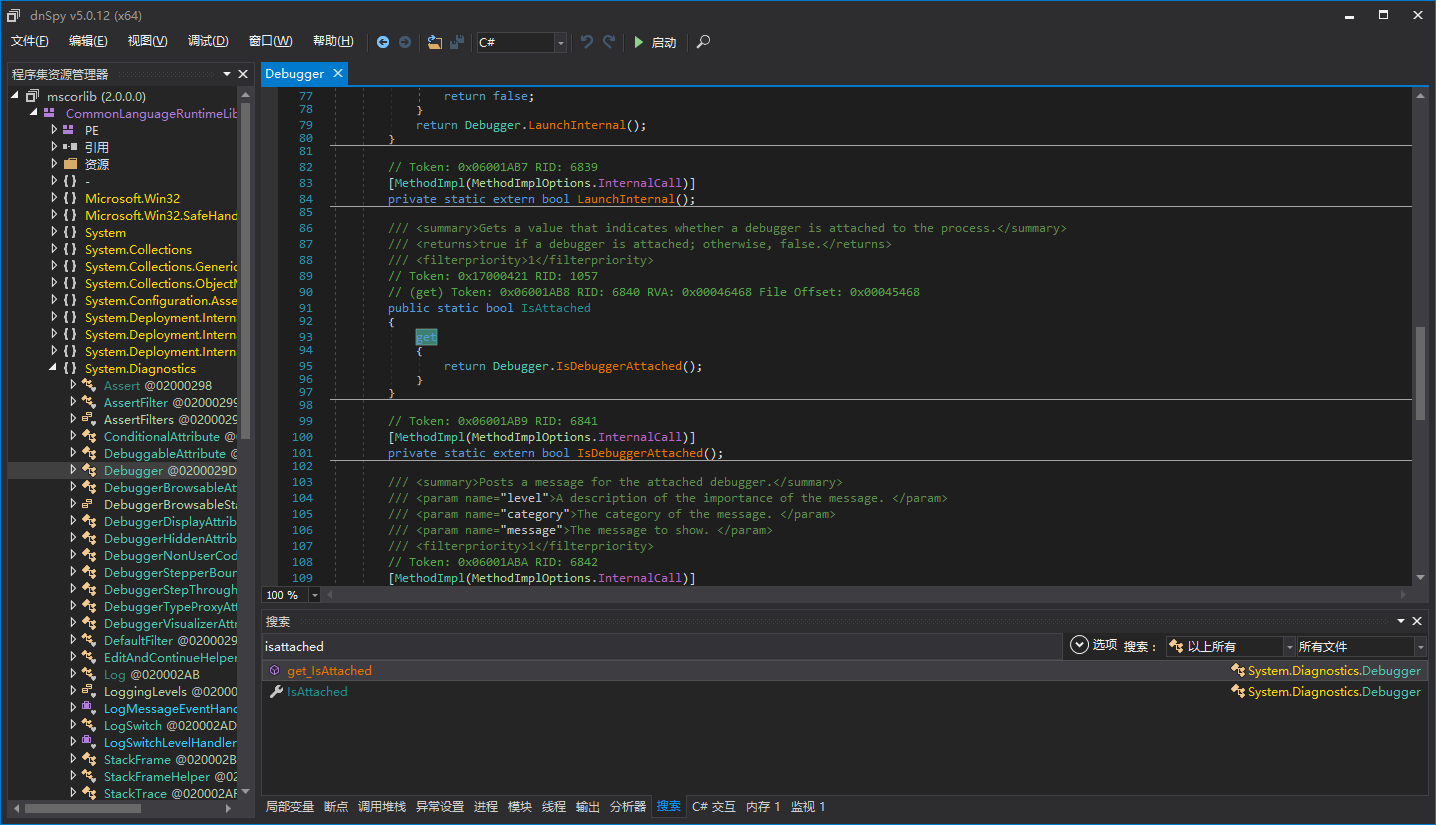
Because the get property of Debugger.IsAttched from .NET 2.0 to 3.5 is a managed method, which may be directly patched, causing vulnerabilities in the detection of managed debuggers under .NET 2.0 to 3.5.

Author

wwh1004

Posted on

2018-12-22

Updated on

2023-04-12

Licensed under

CC BY 4.0


Comments